웹로그를 이용한 페이지 연관분석
0. 개요
웹로그의 referer 정보를 이용하여 페이지간의 연결구조를 파악하면,
레이지 링크를 따라움직이지 않고 직접 URL에 접근 또는 임시 페이지 및 취약한 페이지를 찾을수 있다 는 가설을 세우고 접근
1. 웹로그
대상 referer 가 존재하는 웹로그
2. map reduce
웹로그에서 필요한 정보만 출력
– 정적인 페이지 제외(.gif, .jpg, .png, .swf, .css, .js, .dwr, .htc, .flv, .xml)
– 외부 referer 는 제외
– output 은 아래와 같은 format
referer|requesturi^status cnt
input weblog
xxx.xxx.xxx.xxx	-	-	[01/Feb/2013:00:00:51 +0900]	"GET /btn_byline.gif HTTP/1.1"	200	2931	"http://domain.com/info.do?cmd=main&mid=84"			HTTP/1.1	410
xxx.xxx.xxx.xxx	-	-	[01/Feb/2013:00:00:51 +0900]	"GET /pop_close.jpg HTTP/1.1"	200	1633	"http://domain.com/info.do?cmd=main&mid=84"			HTTP/1.1	680
xxx.xxx.xxx.xxx	-	-	[01/Feb/2013:00:00:51 +0900]	"GET /ico_arrow.gif HTTP/1.1"	200	57	"http://domain.com/info.do?cmd=main&mid=84"			HTTP/1.1	450
xxx.xxx.xxx.xxx	-	-	[01/Feb/2013:00:00:51 +0900]	"GET /include/common/calendar.jsp HTTP/1.1"	200	7584	"http://domain.com/info.do?cmd=main&mid=84"			HTTP/1.1	4670
xxx.xxx.xxx.xxx	-	-	[01/Feb/2013:00:00:51 +0900]	"GET /js/counter/counter.js HTTP/1.1"	200	6121	"http://domain.com/info.do?cmd=main&mid=84"			HTTP/1.1	720
xxx.xxx.xxx.xxx	-	-	[01/Feb/2013:00:00:51 +0900]	"GET /calendar/calendar.js HTTP/1.1"	200	2073	"http://domain.com/include/common/calendar.jsp"			HTTP/1.1	1350
xxx.xxx.xxx.xxx	-	-	[01/Feb/2013:00:00:51 +0900]	"POST /info.do HTTP/1.1"	200	299	"http://domain.com/info.do?cmd=main&mid=84"			HTTP/1.1	97320
xxx.xxx.xxx.xxx	-	-	[01/Feb/2013:00:00:51 +0900]	"GET /include/common/tags.js HTTP/1.1"	404	881	"http://domain.com/include/common/calendar.jsp"			HTTP/1.1	3360
output
/|/index.jsp^200	1150
/|/index.jsp^500	1
/|/info.do^200	4
./index.jsp|/combi.do^200	2
./index.jsp|/notice.do^200	1
./info.do|/notice.do^200	1
3. python
map reduce의 결과 output을 d3에서 사용할수 있는 json 으로 변환해주는 프로그램
]$ cat page_link.py
#!/usr/bin/python

import sys, glob
import commands
import time
from datetime import timedelta, date
from os.path import *


def getYesterday():
        d=date.today()
        td=timedelta(days=-1)
        yd=d+td
        return yd.strftime("%Y%m%d")

def writeLog(data) :
        log_date = stxDate
        log_file = "/page_link/" + log_date + ".log"
        fp = file(log_file, 'a+')
        now = time.strftime("%Y-%m-%d %H:%M:%S", time.localtime(time.time()))
        comment = "["+str(now)+"] "+str(data)+"\n"
        fp.write(comment)
        fp.close()

def faile_check(fail):
    if fail:
        writeLog("Failed =>" + str(fail))
        sys.exit(1)

def command(cmd):
        writeLog(cmd)
        fail, res = commands.getstatusoutput(cmd)
        faile_check(fail)
        return res


stxDate = getYesterday()
inputfile = sys.argv[1]
outputfile = sys.argv[2]


# hadoop file down
if exists("/page_link/"+stxDate):
        cmd="rm -rf /page_link/"+stxDate
        command(cmd)
        cmd="/home/hadoop/hadoop/bin/hadoop fs -get "+inputfile+" /page_link/"+stxDate
        command(cmd)
else :
        cmd="/home/hadoop/hadoop/bin/hadoop fs -get "+inputfile+" /page_link/"+stxDate
        command(cmd)


# get all file count
cmd="wc -l /page_link/"+stxDate+" |awk '{print $1}'"
cnt = command(cmd)
i = int(cnt)

# log line process
nodes = [];
links = [];
fo = open("/page_link/"+stxDate,"r")
while i > 0 :
        line = fo.readline().rstrip('\n')
        cols = line.split('\t')
        # cols : refer | request ^ status \t 1
        node = cols[0].split('|')
        nodes.append(str(node[1]))
        links.append(dict(source=str(node[0]), target=str(node[1])))
        i-= 1
fo.close();

# unique node info
nodes = list(set(nodes))


#make node json format
nodes2 = [];
json = "{ \"nodes\": [";
for node in nodes :
        if node.rfind("^", 1) > 0 :
                url = node.rsplit("^",1)[0].replace("\\","")
                status = node.rsplit("^",1)[1]
                nodes2.append(url)
                json = json + "{\"name\":\""+ url +"\", \"count\":3, \"group\":\""+status+"\"},"
        else :
                json = json + "{\"name\":\""+ node +"\", \"count\":3, \"group\":\"ref\"},"

json = json.rstrip(",") + " ],\n\"links\": [";


#make link json format
for link in links :
        idx_target = nodes.index(link["target"])
        try :
                idx_source = nodes2.index(link["source"])
        except :
                idx_source = 0

        json = json + "{\"source\":"+ str(idx_source) +", \"target\":"+str(idx_target)+"},"

json = json.rstrip(",") + " ] }";

#print("//=================================")
#print(json)
#print("//=================================")

#make json file
json_file = "/page_link/"+outputfile+".json"
fp = file(json_file, 'w')
fp.write(json)
fp.close()
4. d3
시각화 도구로 d3를 선택했다. http://d3js.org/
https://github.com/mbostock/d3/wiki/Gallery 여기에 가면 많은 d3 예제가 있는데,
나는 특별히 Fisheye Distortion (http://bost.ocks.org/mike/fisheye/) 를 사용했다.
여기서 연결 구조만 사용하고 실제 샘플의 Fisheye Distortion 기능은 사용하지 않았다.
Fisheye Distortion 예제를 기초로 수정한 소스
<!DOCTYPE html>
<head>
<meta charset="utf-8">
<style>
text {
  font: 10px sans-serif;
}

.node {
  stroke: #fff;
  stroke-width: 1.5px;
}

.link {
  stroke: #999;
  stroke-opacity: .6;
}

.background {
  fill: none;
  pointer-events: all;
}

#chart1 {
  width: 1000px;
  height: 500px;
  border: solid 1px #ccc;
}

#chart1 .node {
  stroke: #fff;
  stroke-width: 1.5px;
}

#chart1 .link {
  stroke: #999;
  stroke-opacity: .6;
  stroke-width: 1.5px;
}

#chart1 .status {
  stroke: #999;
  stroke-opacity: .6;
  stroke-width: 1.5px;
}

circle.node.200{
    fill:black;
}

</style>
<script src="/lib/d3.v2.min.js?2.9.4"></script>
<script src="/lib/jquery-1.9.0.min.js"></script>
</head>

<body>
<select id="date">
	<option value="20130131">20130131</option>
	<option value="20130201">20130201</option>
</select>
<select id="domain">
	<option value="www.aaa.com">www.aaa.com</option>
	<option value="www.bbb.co.kr">www.bbb.co.kr</option>
    <option value="www.ccc.com">www.ccc.com</option>
</select>

<input type="button" id="search" name="search" value="search"/>
<div id="msg"></div>

<p id="chart1"></p>

<script>
var width = 1000,
height = 500;

var color = d3.scale.category20();

var force = d3.layout.force()
.charge(-20)
.linkDistance(20)
.size([width, height]);


var svg = d3.select("#chart1").append("svg")
.attr("width", width)
.attr("height", height);

svg.append("rect")
.attr("class", "background")
.attr("width", width)
.attr("height", height);

$("#msg").text('select date and domain and search!');

function draw(data) {
    var n = data.nodes.length;

    var domain=[];
    data.nodes.forEach(function(d){
           domain.push(d.group);
    });
    domain = domain.sort()
    color.domain(domain);
    var lengend_height = 22 * domain.unique().length;
    var legend = d3.select("#chart1").append("svg").attr("class", "legend").attr("width", 100).attr("height",lengend_height).attr("x", width).attr("y", height)
    .selectAll("g").data(color.domain()).enter().append("g").attr("transform", function(d, i) {
        return "translate(0," + i * 20 + ")";
    });

    legend.append("rect").attr("width", 18).attr("height", 18).style("fill", color);

    legend.append("text").attr("x", 24).attr("y", 9).attr("dy", ".35em").text(function(d) {
        return d;
    });


    force.nodes(data.nodes).links(data.links);

    // Initialize the positions deterministically, for better results.
    data.nodes.forEach(function(d, i) { d.x = d.y = width / n * i; });

    // Run the layout a fixed number of times.
    // The ideal number of times scales with graph complexity.
    // Of course, don't run too long?you'll hang the page!
    force.start();
    for (var i = n; i > 0; --i) force.tick();
    force.stop();

    // Center the nodes in the middle.
    var ox = 0, oy = 0;
    data.nodes.forEach(function(d) { ox += d.x, oy += d.y; });
    ox = ox / n - width / 2, oy = oy / n - height / 2;
    data.nodes.forEach(function(d) { d.x -= ox, d.y -= oy; });

    var link = svg.selectAll(".link")
        .data(data.links)
      .enter().append("line")
        .attr("class", "link")
        .attr("x1", function(d) { return d.source.x; })
        .attr("y1", function(d) { return d.source.y; })
        .attr("x2", function(d) { return d.target.x; })
        .attr("y2", function(d) { return d.target.y; })
        .style("stroke-width", function(d) { return Math.sqrt(d.value); });

    var node = svg.selectAll(".node")
        .data(data.nodes)
        .enter().append("circle")
        .attr("class", "node")
        .attr("cx", function(d) { return d.x; })
        .attr("cy", function(d) { return d.y; })
        .attr("r", 3)
        .style("fill", function(d) {  return color(d.group); })
        .call(force.drag);

    node.append("title")
    .text(function(d) { return d.name; });
}

$("#search").click(function(){
    file = "/resource/"+$("#domain").val() +"_"+$("#date").val()+".json"
    $("#msg").text('');
    //alert(file);
    d3.selectAll('.legend').remove();
    d3.selectAll('.node').remove();
    d3.selectAll('.link').remove();

    d3.json(file, draw);
});

Array.prototype.unique=function() {
    var newArray=[], len=this.length;
    label:for(var i=0; i<len; i++) {
      for(var j=0; j<newArray.length; j++)
        if(newArray[j]==this[i]) continue label;
      newArray[newArray.length] = this[i];
    }
    return newArray;
  }

</script>

</body>
데이터의 포맷..
{
    "links": [
        {
            "source": 0,
            "target": 1
        },
        {
            "source": 0,
            "target": 2
        },
        {
            "source": 1,
            "target": 3
        },
        {
            "source": 1,
            "target": 4
        },
        {
            "source": 1,
            "target": 5
        },
        {
            "source": 2,
            "target": 6
        },
        {
            "source": 2,
            "target": 7
        }
    ],
    "nodes": [
        {
            "name": "/",
            "count": 30
        },
        {
            "name": "/a.html",
            "count": 20
        },
        {
            "name": "/b.html",
            "count": 10
        },
        {
            "name": "/a/a1.html",
            "count": 7
        },
        {
            "name": "/a/a2.html",
            "count": 10
        },
        {
            "name": "/a/a3.html",
            "count": 3
        },
        {
            "name": "/b/b1.html",
            "count": 7
        },
        {
            "name": "/b/b2.html",
            "count": 3
        }
    ]
}
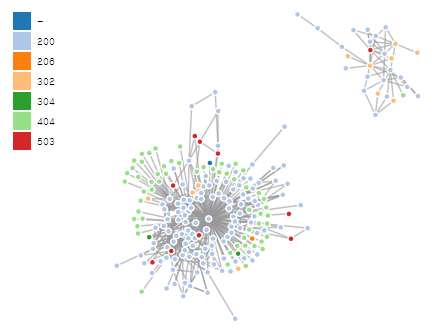
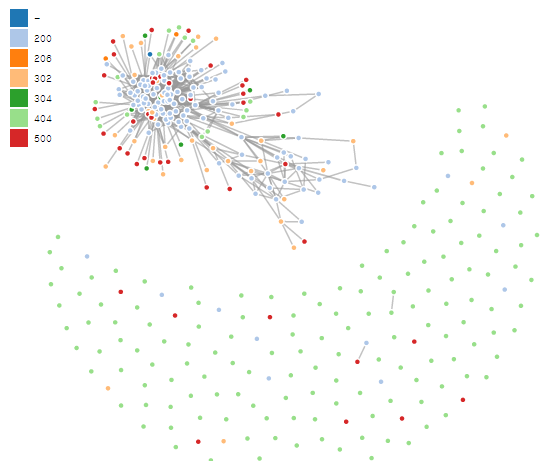
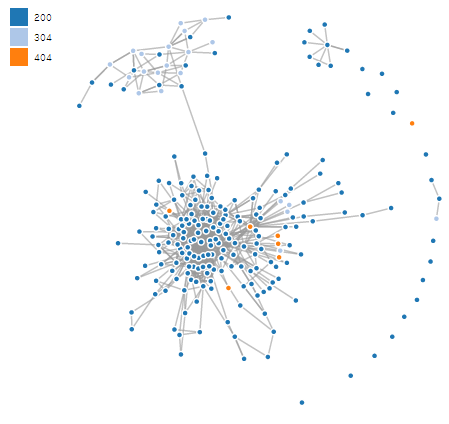
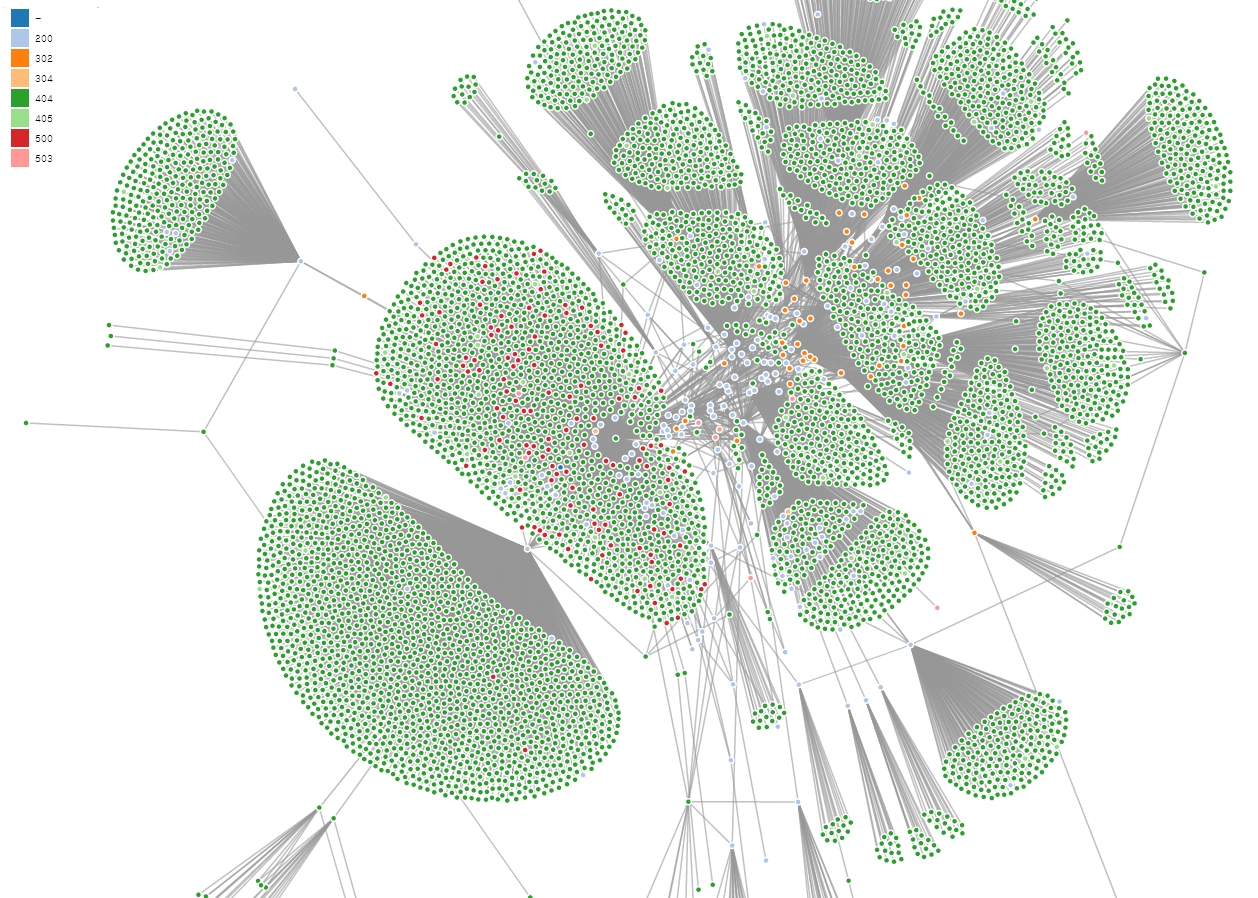
결과는 아래와 같은 형태로 나온다.